User Guide
Introduction
mySymptoms enables you to conveniently record what you eat and drink along with any symptoms you experience. This information can then be analyzed in an attempt to identify any correlations (possible links) between what you ate and drank and the symptoms you experienced.
How to Use mySymptoms
You can record as much or as little as you
find convenient and appropriate for your symptoms. However, for most symptoms
it is recommended that you aim to record as much detail as possible -
including all of the ingredients of the foods you eat, any drinks you consume,
and any medications or supplements you take. Other factors such as specific
exercises, stress levels, and environmental factors may also be important to
record.
When you first use the app you will likely find that the food database doesn't include all the foods you eat. When searching for a food, if it doesn't appear in the results, simply tap the + button and it will be added to the food database for future use. After you've been using the diary for a few days, you should find data entry becomes much easier as the app begins to show you your 'favorite' foods for each daily meal.
Don't worry too much if you miss the odd ingredient here or there, or if you miss the occasional meal or drink - so long as it's not an ongoing lapse!
When you suffer any symptoms, you should record them in your diary with the time set to the initial onset of the symptoms. You should also set the intensity of a symptom to be the average intensity of the symptom over the duration of the episode (event), even if the symptom lasts for a number of hours. (This is done so as not to confuse the analysis algorithm - if you record multiple events over a few hours, each with a different intensity for the same symptom, the analysis algorithm will assume the events aren't related to each other and will place too much significance on them, reducing the algorithm's performance.)
It
is important to note that for the app to be effective, you must also add what
you eat and drink even when you have no symptoms.
Additionally, to get the best results, you
should aim to provide the ingredients
of the meals you eat as it is typically individual ingredients that cause
symptoms.
Before running the analysis, you can configure the time period over which to analyze depending upon your needs. For example, you can analyze 'ALL' of your diary, '6 MONTHS', '3 MONTHS', or a specified date 'RANGE'. Additionally, for each symptom, you can configure a number of analysis parameters. (See the section 'Results' below)
The number of diary entries required to produce useful results varies greatly as the analysis performance is dependent upon a number of factors - including; how varied your diet is (the more varied the better), how often you experience symptoms (the less frequent the better as symptom-free periods reveal important information), and whether the information in your diary sufficiently describes the factors that affect your symptoms.
Once you've run the analysis for a symptom, a 'Top Suspects' results table will be displayed. The table is ordered, starting with the highest scoring item at the top. You can find out more information about the score of an individual item by tapping on it to open the 'Result Detail' screen. (For more information about the results detail see the section 'Results' below.)
In addition to adding foods to diary events, you can also add and modify foods, drinks, medications, etc., using the 'Organizer'. Simply search under the appropriate category, and then add or modify an item as required.
Finally, the 'More' tab provides features including generating a PDF of your diary for sharing with you doctor/dietitian, quick start guide, and our contact details for reporting issues or providing enhancement suggestions.
Diary
The Diary tab provides you with a day-view
calendar and a means of recording events (e.g. a meal) and outcomes (e.g.
symptoms).
Navigating and Viewing Your
Diary
You can navigate your diary a day at a time
using the back and forward arrows on either side of the date. Alternatively,
you can use left and right swipe actions across the screen. Navigation by
calendar can be accessed by tapping on the diary date.

Additionally, if you simply wish to return to today, tap the 'today' button on the navigation bar.
Adding a Diary Event
To add a new diary event, simply tap the + button
on the action bar. You will then be prompted with a list of Events and
Outcomes.
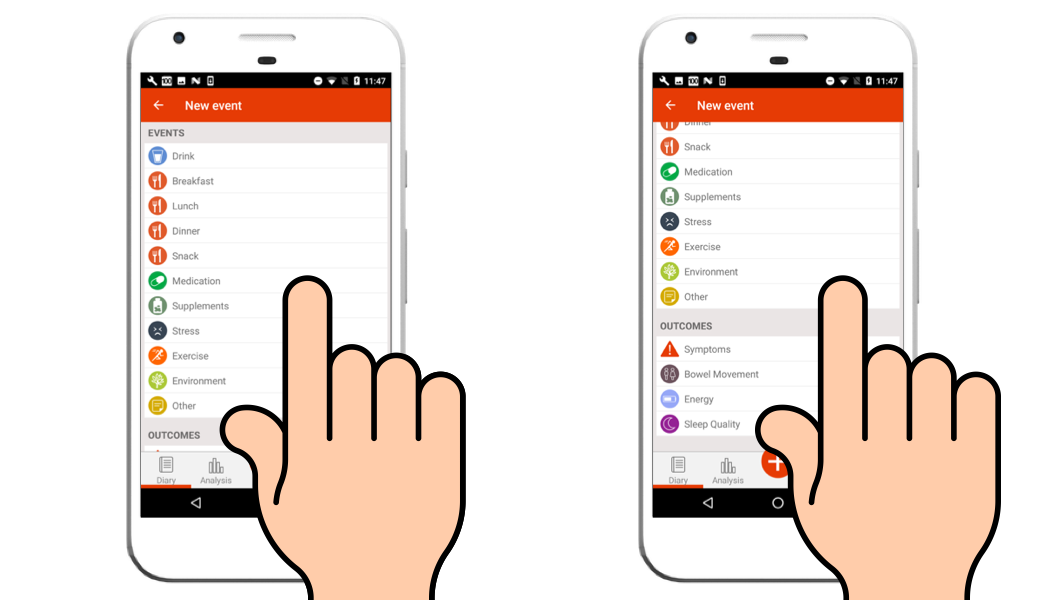
Events
On selecting an event you will be presented
with a screen consisting of the date/time, event type, and contents of the
event. Additionally, notes can be added to each event.
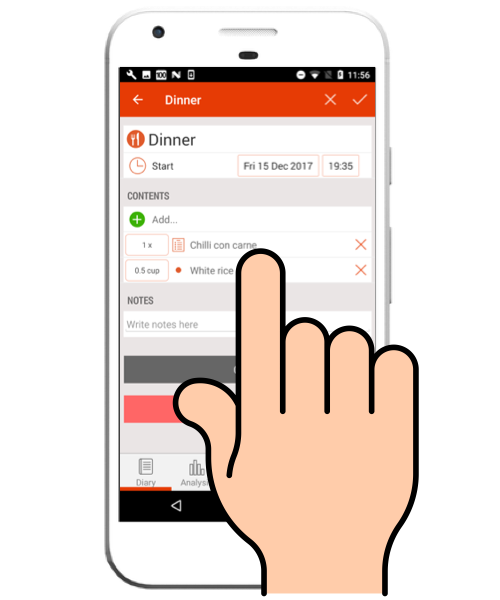
Date / time
The time of the event will default to the current time, but you can change the time by simply tapping it.
Adding
foods / items
In an event, if you tap 'Add content', a search bar will appear and you will be presented with a list of most frequent items selected for this event type - i.e. 'favorites'. You can select multiple items from this list by tapping on each item's + button followed by the done (tick) on the action bar.
Alternatively, you can search for foods / items from the food database using the search bar. Once you've found what you're looking for, tap on it to add it to your diary event. For more details about the food database, please refer to the section 'Organizer'.
If you can't find what you're looking for, then you can add new items from the search screen - simply enter the name of the item followed by the + button on the action bar.
To remove an item from an event, tap the delete button corresponding to the item.
You can also change the event type, date/time, and notes by tapping on them.
Outcomes
On selecting 'symptoms' you will be presented
with a screen consisting of the date, a list of symptoms each with an intensity
slider, the duration of the symptom(s), and a notes section.
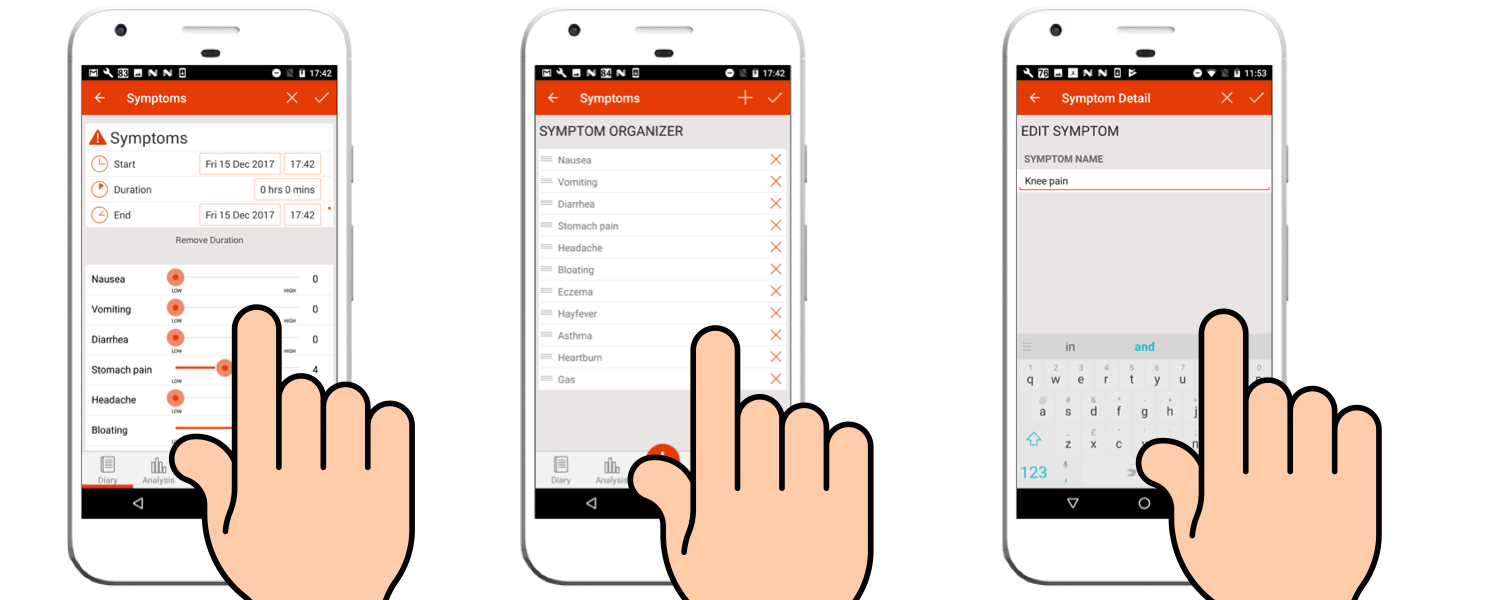
Simply record the intensity for one or more symptoms by setting the appropriate intensity sliders. You can also record the duration of the symptom and provide notes for when you create a PDF report of your diary contents. (Duration and notes are not used by the analysis.)
Adding Your Own Symptoms
Additionally, you can add your own symptoms by tapping 'Organize symptoms'. This provides you with the current list of symptoms that you can change or add to using 'Add new symptom'. You can also delete a symptom by selecting the corresponding delete button. Please note that this removes all occurrences of the symptom throughout your diary.
Energy and Sleep Quality are very similar to 'symptoms' but only provide a single intensity slider. Bowel movement provides the Bristol Scale for tracking bowel movements.
Viewing, Editing, and
Deleting a Diary Event
To view a diary event, simply tap on it
from the diary screen.
Once viewing a diary event you can modify the event. The trash can button on the action bar can be used to delete the event from your diary.
Results
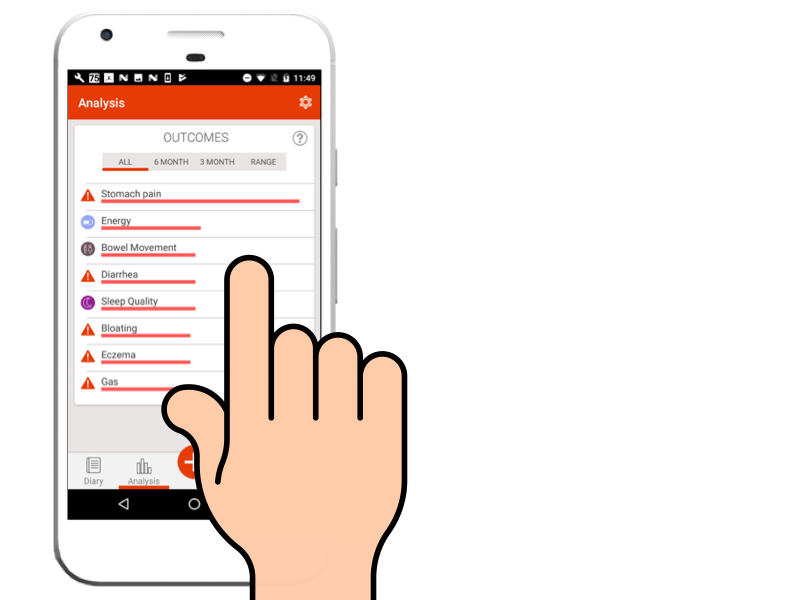
Outcomes Experienced
The first screen in the results tab will
show you the list of outcomes experienced (those recorded in your diary). The
list is shown in descending order, with the most frequent outcome at the top
and the least at the bottom.
The bar length provides a visualization of
the number of occurrences.
Date Range
You can select the date range of the analysis from the filter bar or by tapping the configure button (gears icon) on the action bar.
Select a symptom by tapping it. This will then open the 'Top Suspects' screen.
You can also view the 'Intensity Trend' chart for each outcome by tapping on the corresponding trend chart icon to the right of each outcome. This shows the average intensity of the selected outcome/symptom over a period of weeks or months.
Top Suspects
Top suspects provides a list of items in
your diary that are suspected of being linked to the outcome you've selected
for analysis. The suspects are shown in descending order, with the top suspect
shown at the top of the list and the lowest scoring suspect at the bottom.
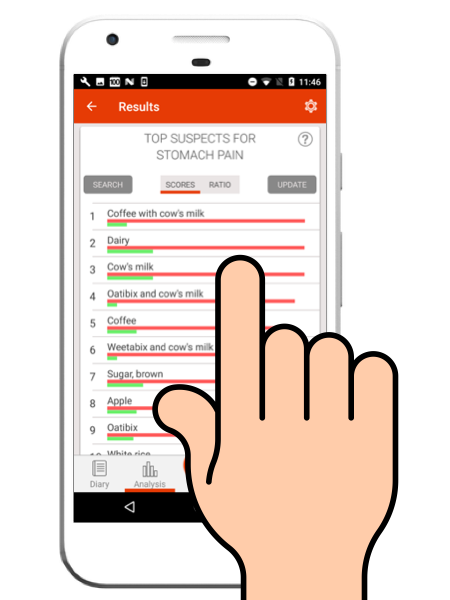
The SCORES / RATIO buttons show two
different lists - the SCORES list shows the top suspects ordered by score (as
calculated by our algorithm), whilst the RATIO list shows the top suspects
ordered by 'suspect ratio' (i.e. how often an item appears as a suspect versus
non-suspect).
The orange bar represents the score of the
item relative to the other items. The green bar represents the confidence of
the result.
PLEASE NOTE: Just because an item is in the
Top Suspects list doesn't mean that it's a cause of your symptom/outcome. The
algorithm can't identify cause - only correlation. Therefore, sometimes
coincidence means that items not associated with a symptom/outcome appear in
the list.
The top suspects are calculated each time you select a different outcome from the proceeding 'Outcomes Experienced' screen. You can also force an update/refresh of the results by tapping the 'Analyze' button.
You can configure certain parameters of the analysis for the selected outcome by tapping the configure button (gears icon) on the action bar (see below for more details).
Select a suspect item by tapping it. This will then open the 'Result Detail' screen.
Configure Analysis
By default the analysis algorithm uses the
intensity setting of each outcome/symptom in an event when calculating the
results. This can be turned off by flipping the 'Use Symptom Intensity' switch
to 'OFF'.
You can also set the 'Analysis Window' anywhere between 1 hour and 72 hours. Each time an outcome/symptom occurs in your diary, the algorithm will look at all events that fall within the preceding 'Analysis Window' period. The default is 24 hours.
Finally, you can set the intensity threshold at which the analysis includes an outcome/symptom event with an intensity greater than or equal to, or less than or equal to the value chosen.
Result Detail
The result detail screen consists of three panels
that can be scrolled between by swiping the screen from right to left and
vice-versa.
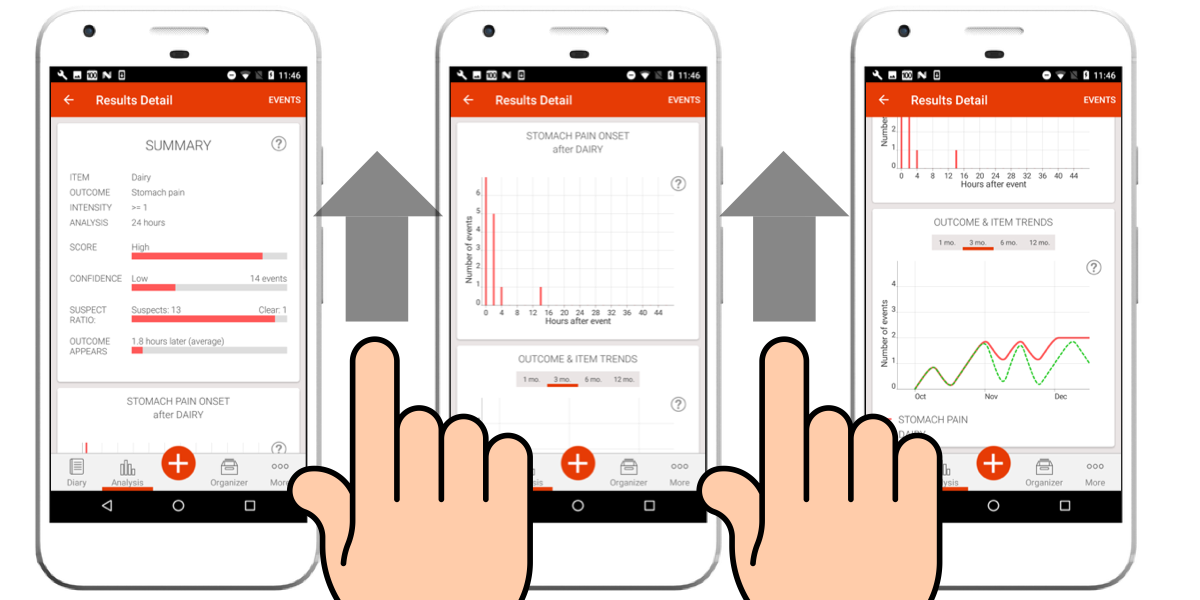
1. SUMMARY RESULTS
Score: The overall score relative to all other items in your diary. The higher the score, the stronger the correlation between the item and outcome. Please note: correlation doesn't not mean cause - sometimes coincidence results in items that don't cause outcomes attaining a high score.
Confidence: Represents the confidence of the result based upon the number of events the item occurs in.
Suspect Ratio: The ratio of suspect events to clear events. A suspect event is an event containing the item that falls within the 'Analysis Window' time period prior to the selected outcome.
Outcomes/Symptoms Appear: The average time delay between events containing the item and the outcome/symptom occurring.
2. OUTCOME/SYMPTOM ONSET DELAY
This chart shows the frequency of the onset delay - i.e. the time from eating a food to the onset of the symptom.
For example, the symptom 'Stomach Pain' might occur 5 times within 1 hour after eating a food containing cow's milk; 4 times within 2 hours, etc.
Sometimes a clear 'peak' can be seen, possibly indicating a significant result / possible sensitivity.
3. OUTCOME/SYMPTOM & ITEM TRENDS
This trend chart shows how often both the given outcome/symptom and the item occur over a period of weeks or months. The closer the two lines, the stronger the correlation.
Events
The events screen provides a list of all
events associated with the selected item and outcome/symptom. The list can be
filtered to show:
- SUSPECT: Suspect and outcome/symptoms events. (Suspect events contain
the item and are within the 'Analysis Window' period prior to the
outcome/symptom.)
- ALL: All events containing the item and all events containing the
outcome/symptom.
Organizer
The organizer allows you to search, add, or edit drinks, foods, medications, supplements, exercises, environmental factors, and 'other' items.
Symptoms can also be added, edited and deleted using the organizer.

Food Database
Use the food database search to find foods
/ items. Simply enter the name of what you're searching for and review the
results for a match.
Local Results
The local results section provides a list of matching items held in the food database on your device.
mySymptoms Cloud Results
The cloud results section provides a list of matching items from our cloud database.
What the Icons Mean
|
|
An item (no ingredients) |
|
|
An item that contains ingredients |
|
|
A recipe containing many ingredients |
Add a New Item
Add a new item by entering the name of the item followed by the + button on the action bar or the 'Add new item' button.
You will then be shown a screen containing the details of the item. Please complete as much information as accurately as you can.
Once done, you are prompted to share the item with the community or to keep it private for your use only.
View an Item
View an item from the results simply by tapping on it. You will then see:
|
Brand |
The brand name |
|
Barcode |
The barcode |
|
Category |
Foods / drinks / medications / etc |
|
A kind of |
What kind of item is it? E.g. Mozzarella is a Cheese, and Cheese is Dairy |
|
My recipe |
A recipe (private) |
|
Ingredients |
A list of ingredients |
Edit an Item
When you are viewing an item, you can modify it as necessary (perhaps corrections, or adding further detail).
On saving any changes you are prompted to share the item with the community or to keep it private for your use only.
Accuracy
If you believe the item is not accurate, then you can down-vote it relative to other items that share the same name.
Equally, if you believe the item is accurate, then you can up-vote it relative to other items that share the same name.
This helps everyone. Thanks! :-)
Report item
If you see any inappropriate or abusive content, please report this immediately using the report item button. Thank you for your help.
More
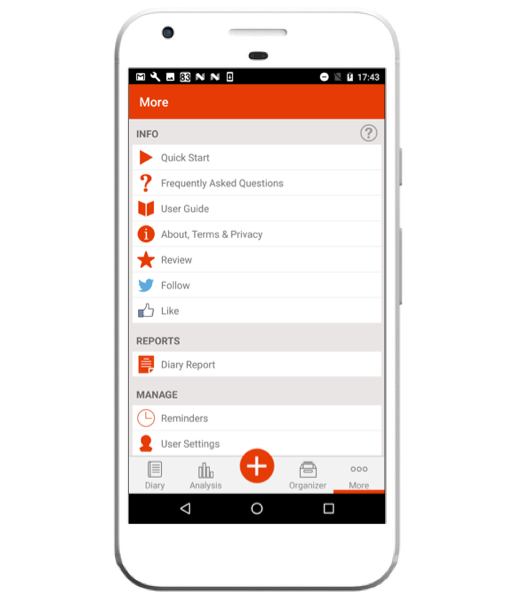
Diary Report
To view or print your diary, tap 'Diary Report' and send yourself (or doctor / dietician) an email with the diary report attached.
You can choose to restrict your diary report to pre-defined time periods such as 'All', 'Past Month', 'Past Week', or a specific date range.
A CSV (Comma Separated Variable) option is also provided for exporting your diary data. The CSV file can then be imported into a spreadsheet for viewing and analysis.
Report an Issue
Please report any issues you experience by
tapping 'Report an Issue'. This will create an email with details of your
device and Android version. Please provide details of the issue you are
experiencing and then send the email to the pre-populated support address.
We will make every effort to respond to your issues as quickly as possible.
Suggest Enhancements
Please suggest any enhancements to the App,
by tapping 'Suggest Enhancements'. This will create an email with a
pre-populated address to send your suggestions to. All suggestions are reviewed
and considered for inclusion in future updates of the App. Thank you.